IoT - Home sensor data monitoring with MQTT, InfluxDB and Grafana
It’s winter now and the weather is pretty cold in France in early 2019.

I live in a small apartment with communal heating system, and so far, I never had to care about heating, except for a few “Hmm, it seems a little cold right now!” moments. And when this happens, some questions come to my mind:
- Is it really cold, or is it just me?
- How different is it from yesterday / last year?
- What’s the temperature difference inside vs outside?
Measuring is important, we know that as developers, otherwise how could we get accurate answers and take the best decisions without data?
Let’s build a system to monitor the inside and outside temperature + humidity.
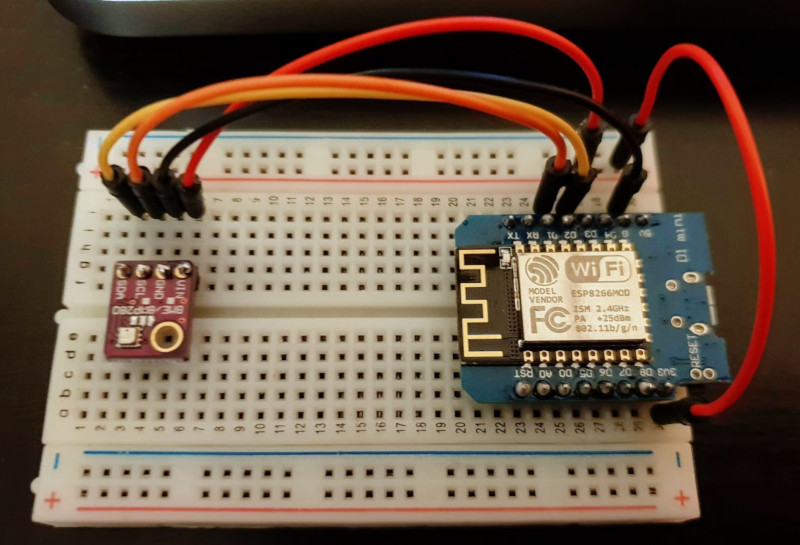
Hardware
We will need:
- A temperature and humidity sensor
- An ESP8266, to communicate with the sensor and send data over WiFi
- A Raspberry Pi, to receive, store, and display data from the ESP8266.
Temperature and Humidity sensor
The most famous temperature and humidity sensors in the makers community are the DHT22 and the BME280. Each cost around $2.50.
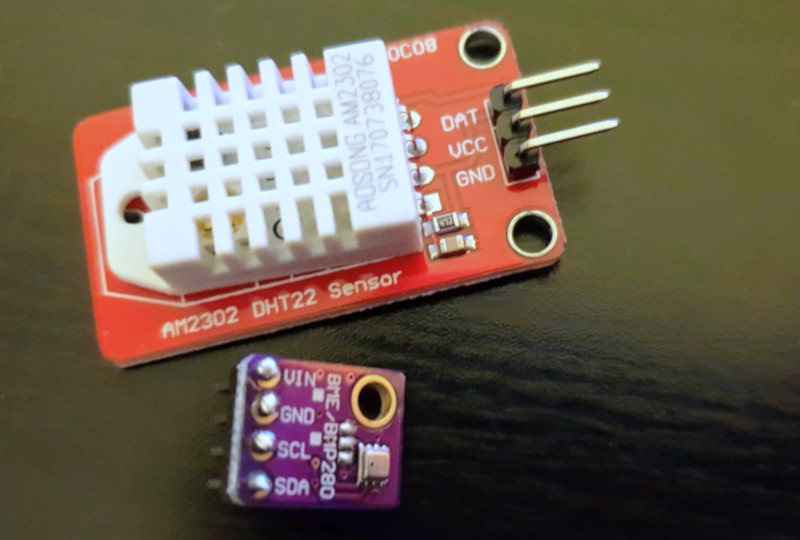
After trying the 2 side by side for a few days, I noticed they were not giving me the exact same temperature: there was a ~2.5°C difference between the two sensors.
Since both are giving me different data, how can I know which is the most accurate one? So I called my parents for help, and they lent me a few mercury thermometers.
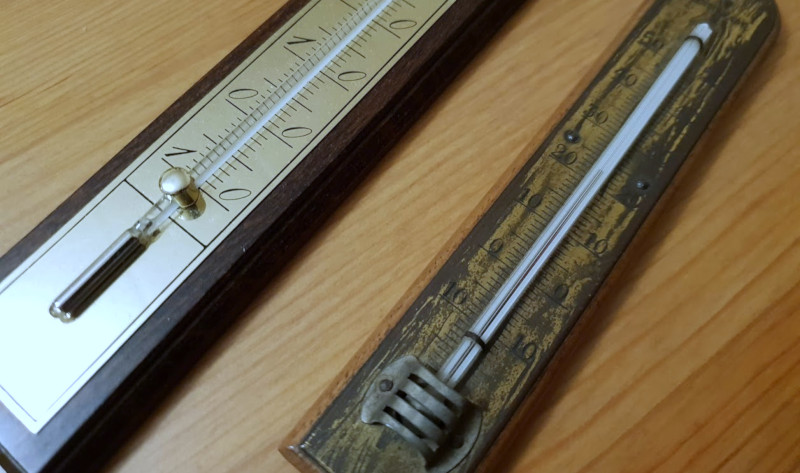
The 2 mercury thermometers were displaying exactly the same temperature, so I assumed that they were accurate.
The DHT22 temperature was ~1.5°C lower. The BME280 temperature was 1°C higher.
After some research, it turned out that, despite its impressive appearance, the DHT22 is actually not a very good sensor. The BME280 is better, but has its own problems too, as it suffers from self-heating in its default configuration (sampling data continuously).
Hopefully, you can write code to change the sampling rate and make the sensor return to sleep mode when the measurement is finished.
The MCU I use is an ESP8266 (Wemos D1 Mini), and I write Arduino code to communicate with the sensor.
Instead of fetching data every second, I decided to fetch once per minute, with the sensor returning to sleep mode immediately after. The temperature it gave me then was very close to the one of the mercury thermometers.
Adafruit_BME280 bme;

void setup() {
  bme.begin(SPI_ADDRESS);
  bme.setSampling(Adafruit_BME280::MODE_FORCED,
                Adafruit_BME280::SAMPLING_X1, // temperature
                Adafruit_BME280::SAMPLING_NONE, // pressure
                Adafruit_BME280::SAMPLING_X1, // humidity
                Adafruit_BME280::FILTER_OFF);
}

void loop() {
  bme.takeForcedMeasurement();
  humidity = bme.readHumidity();
  temperature = bme.readTemperature();
  delay(60000)
}
MQTT broker
MQTT is a popular lightweight pub-sub protocol widely used in IoT.
The Raspberry Pi will host an MQTT server (Mosquitto):
$ docker run -d -p 1883:1883 eclipse-mosquittoAnd the ESP8266 will publish temperature and humidity data to the following MQTT topics:
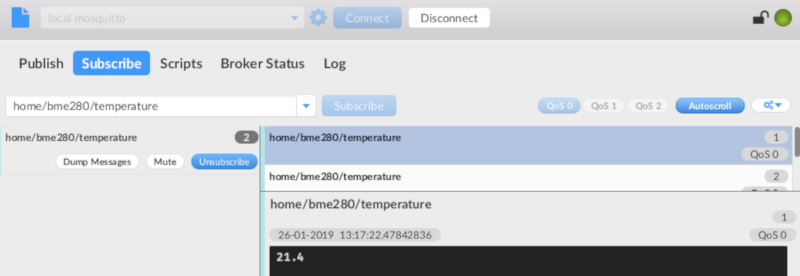
home/bme280/temperaturehome/bme280/humidity
To see if this works, you can use MQTT.fx to connect to your [RaspberryPi IP]:1883 and subscribe to the temperature topic:
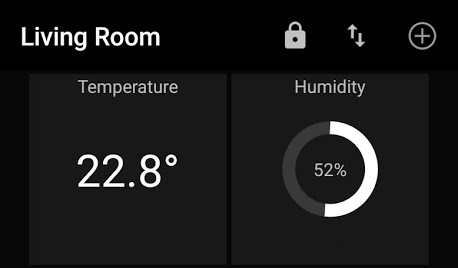
You can also install the MQTT Dash application on your Android device to see temperature data directly on your smartphone:
The complete Arduino implementation for the ESP8266 and the BME280 is available here.
InfluxDB
The Raspberry Pi will store humidity and temperature metrics over the time in an InfluxDB Time Series Database:
$ docker run -d -p 8086:8086 \
    -v $PWD:/var/lib/influxdb \
    influxdb
To avoid damaging your microSD card, it is a good idea to use an external storage (hard drive / NAS / cloud) to store influxdb data.
Now that infuxdb is running, we need to write a small script that subscribes to MQTT events, and persists received data to InfluxDB
def on_message(client, userdata, msg):
  sensor_data = parse_mqtt_message(msg.topic, msg.payload.decode('utf-8'))
  send_sensor_data_to_influxdb(sensor_data)

def parse_mqtt_message(topic, payload):
  match = re.match('home/([^/]+)/([^/]+)', topic)
  location = match.group(1)
  measurement = match.group(2)
  return SensorData(location, measurement, float(payload))

def send_sensor_data_to_influxdb(sensor_data):
  json_body = [
    {
      'measurement': sensor_data.measurement,
      'tags': {
        'location': sensor_data.location
      },
      'fields': {
        'value': sensor_data.value
      }
    }
  ]
  influxdb_client.write_points(json_body)
Complete implementation is available here.
Grafana
So far, the MCU is sending temperature and humidity data every minute to MQTT.
When a message is published, values are automatically persisted to InfluxDB.
Now, we need a tool to show these data over the time in a graph.
Grafana is an open-source, general purpose dashboard and graph composer.
We will install it on the Raspberry Pi:
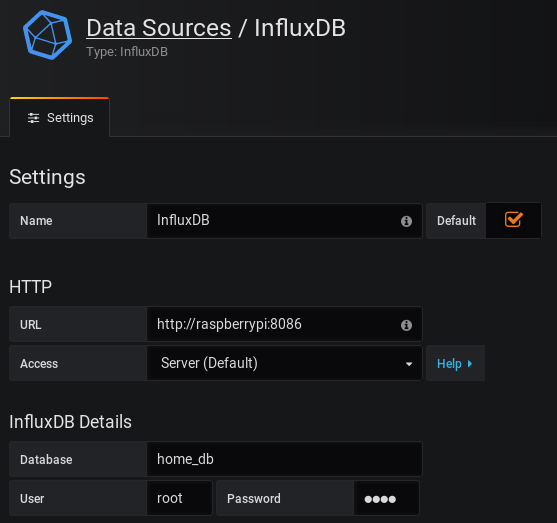
$ docker run -d -p 3000:3000 grafana/grafanaNow we can access it via http://[RaspberryPi IP]:3000 and we can link it to InfluxDB:
Menu > Configuration > Data Sources > Add
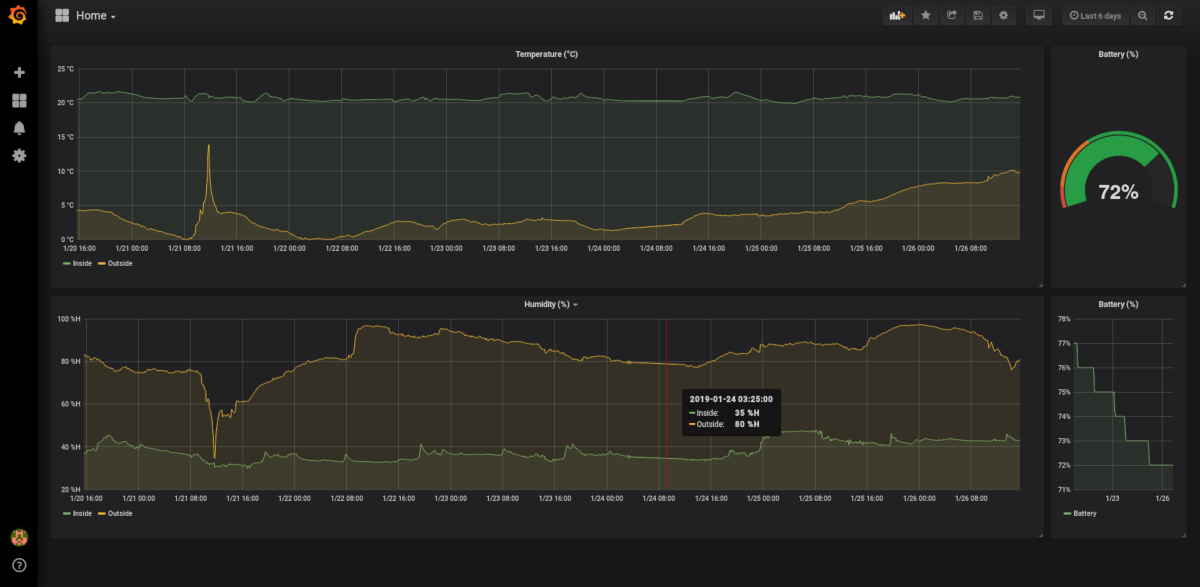
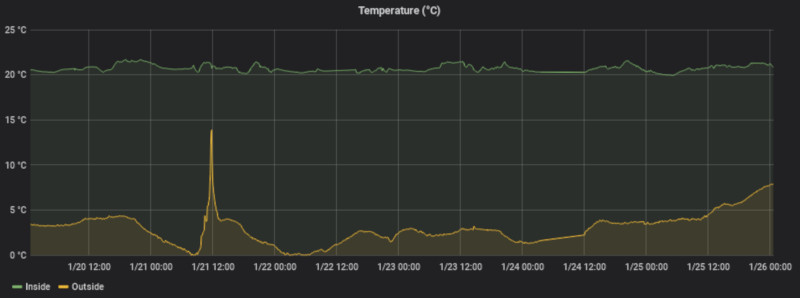
Then we can create a new dashboard (graph) showing the BME280 temperature over the time:
FROM temperature WHERE location=bme280.
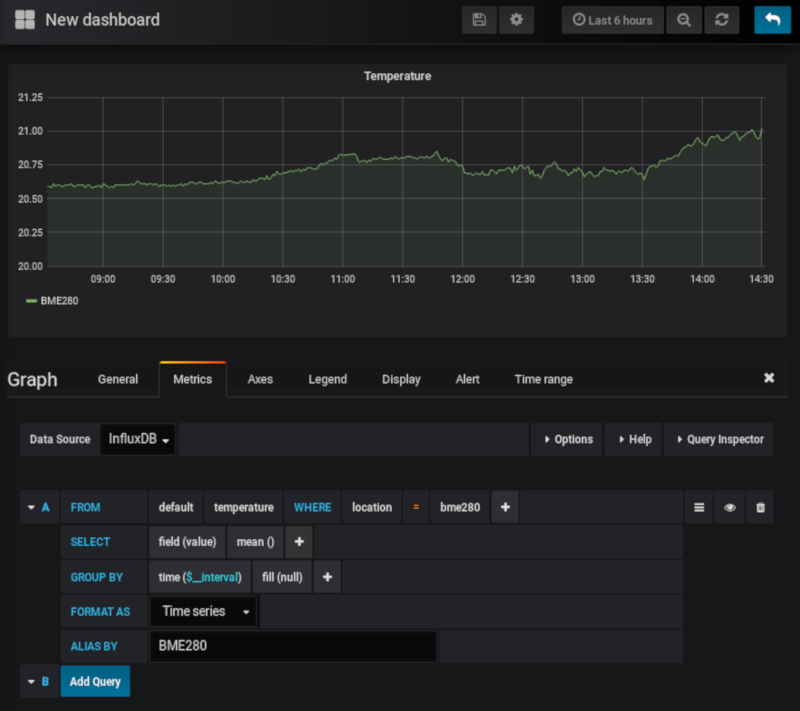
We can then create a similar graph for humidity data.
Docker compose
To automate running containers, we can create a docker compose file.
See the docker-compose.yml here.
Outside temperature
The ESP8266 with the BME280 is a good solution inside the home.
However, I would like to also have the outside temperature and humidity data.
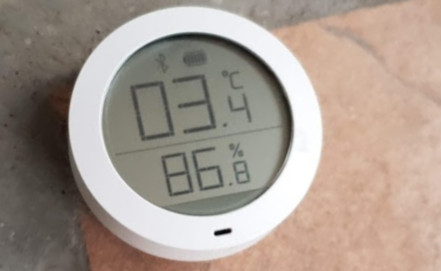
We could build a battery-powered similar device (ESP8266 + BME280), but I am too lazy to build one, so I decided to buy instead a “Xiaomi mijia temperature and humidity sensor” for ~$12.
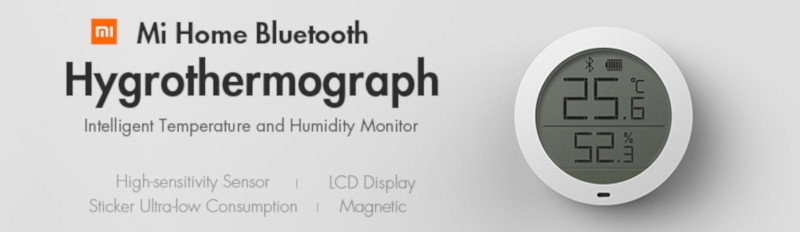
While designed for an indoor usage, it supports temperatures from -9.9°C to 60°C. I’ve been using it outside for a month already and the device works really well.
This device sends data using Bluetooth LE.
You can easily reverse engineer the BLE part, and write your own code that communicates with the device via BLE and publishes data to an MQTT broker.
Full BLE to MQTT implementation here
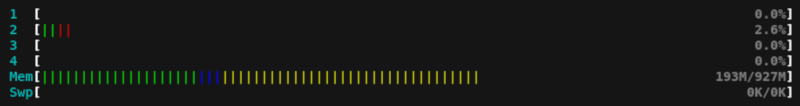
This code in running on the Raspberry Pi 3 B+ along with all the other docker services.
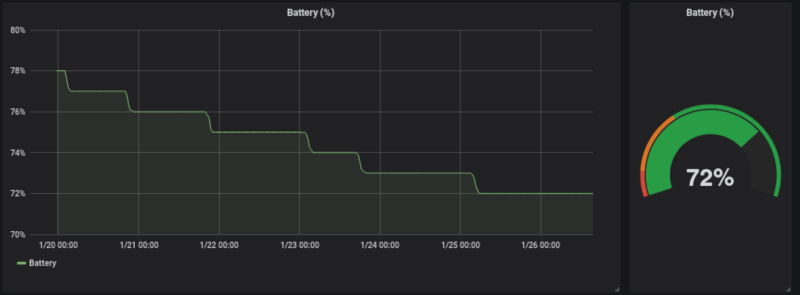
The Mijia device requires a single AAA battery. I use rechargeable batteries and it lasts more than a month.
Conclusion
You can find the complete source code on github.com/Nilhcem/home-monitoring-grafana to build a similar project for your home.
I have been monitoring the inside and outside temperature/humidity for a month, and noticed that I’m getting more and more curious about the weather now.
Actually, the more I have data and the more curious I am.
Size of the influxDB after a month: 30MB.
A future iteration would be to try to do a similar project using exclusively online services, only keeping sensors in the house, getting rid of the Raspberry Pi.